A room-sized piece of equipment immerses participants in a full three-dimensional world for research applications — but that sees even more success as an outreach and educational tool
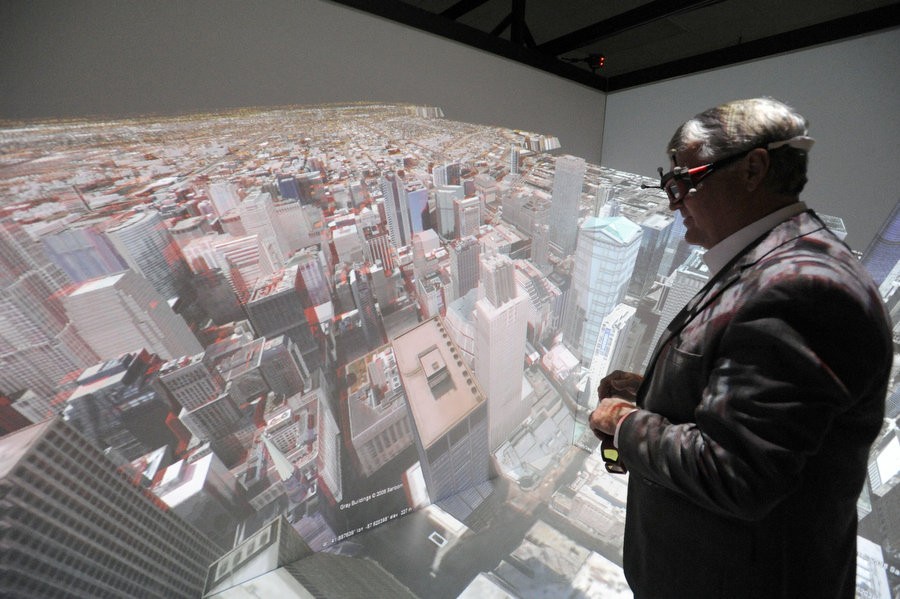
On a recent day at the University of Alabama in Huntsville, I had a Superman moment when given the chance to stand in the air high over the city of Chicago. Of course, it wasn’t the real Chicago – just a detailed and accurate virtual creation – and there was a floor beneath me, even though I saw nothing but roofs when I looked down. […] You can learn and see a lot up here.
—Lee Roop, “3-D cave lets University of Alabama in Huntsville students ‘see’ all sides of data”, al.com
Introduction
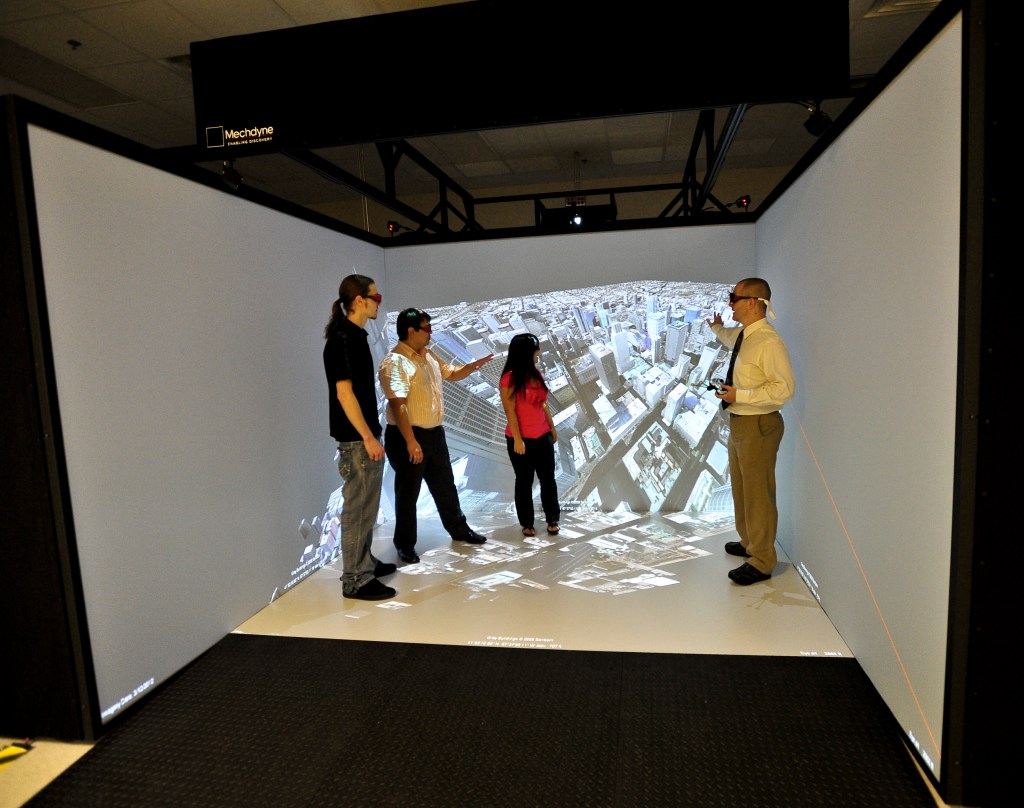
The University of Alabama in Huntsville’s CAVE (Cave Automatic Virtual Environment) is a room-sized virtual space that feels much, much larger. The CAVE is all about immersion: it surrounds you with spectacular visuals and sound, representing environments of all shapes, kinds, and sizes. The CAVE facilitates research by students and professionals alike.
The CAVE provides deep immersion into virtual environments, visualization of research data, and facilitation of hands-on training. The 10’x10’x7.5’ visualization system is composed of three rackmount computers, infrared cameras, and four 1080p (60 Hz) projectors.
CAVE participants can visualize and interact with the CAVE through a series of different hardware mechanisms. A motion-tracked set of 3D glasses further allows a user to become more fully immersed in the environment. He or she can turn and position his or her head and body within the CAVE and seamlessly view the entire scene. A Logitech gamepad is used to navigate and manipulate the scene, including terrain and objects displayed in the CAVE. The gamepad is also motion-tracked; in many applications, it provides a virtual “wand” used to point at objects within the CAVE, intuitively emanating from its position. The CAVE can be extended using other motion-tracked devices as well.

I personally led most of the operations having to do with the CAVE from the beginning, when I first coordinated and oversaw its installation. As part of the NASA grant that funded the equipment, I led a team of undergraduate students that created a series of demonstrations for proof-of-concept and outreach using off-the-shelf software, such as Google Earth and the Trimble Sketchup CAD package. I also coordinated and gave almost all of the tours for student groups, new research faculty, media outlets, potential customers, and researchers.
Overview
The Cave Automatic Virtual Environment (CAVE) is a roughly 10 square foot visualization system composed of three rackmount computers, infrared cameras, and four 1080p (60 Hz) projectors. Constructed by Mechdyne Corporation and funded by a $500,000 grant from NASA, the purpose of the system is to provide deep immersion into virtual environments, visualization of research data, and facilitation of hands-on training.

The grant involved establishing the CAVE as a “proof-of-concept” for university research, with several research artifacts produced in the process. Funding covered equipment, installation, and training, with the final product being a fully operational system with several demonstrations. One component of the grant involved funding undergraduate students to develop several demonstrations for outreach.
Not surprisingly, the CAVE had proven to be a successful outreach and education tool, drawing the attention of several local companies, various professional groups, and recruiting organizations within the university. It has been featured fairly prominently in local media and in publications.
Capabilities of the CAVE
A sampling of software products used by the team:
Virtual Global Explorer and Observatory (vGeo)
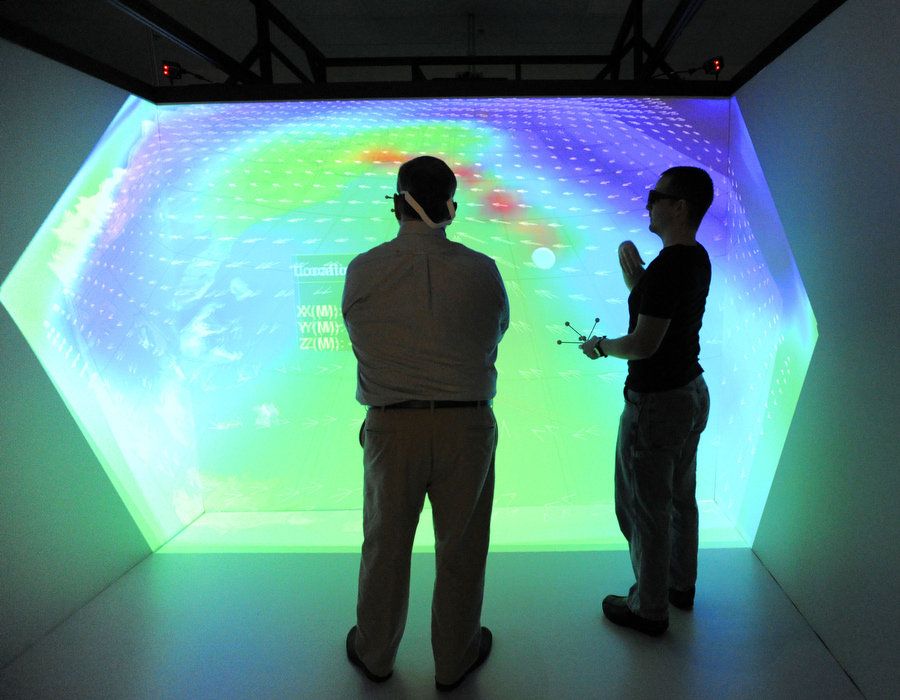
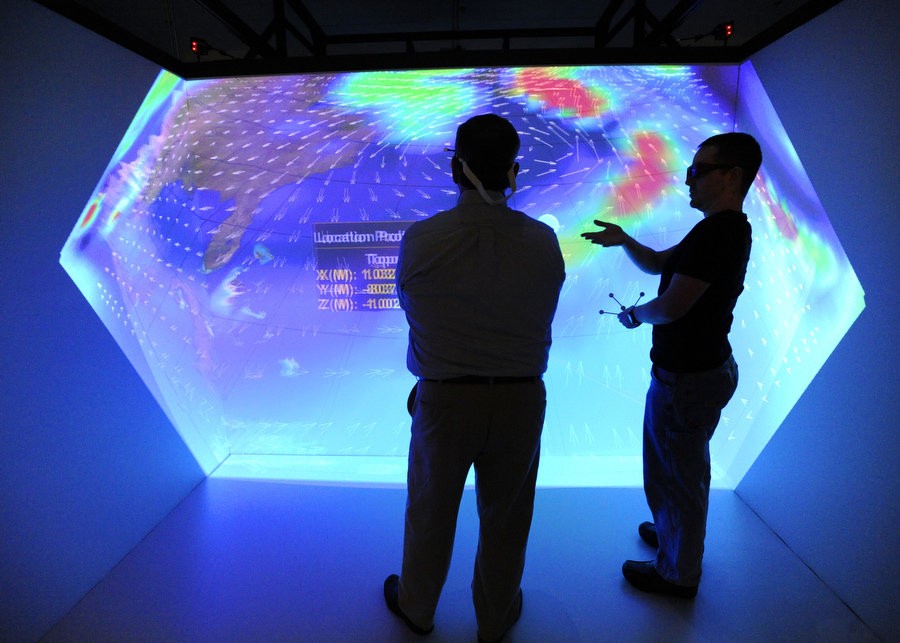
Some software packages were included with the CAVE, including data analytics packages. The Virtual Global Explorer and Observatory (vGeo) application, also developed by Mechdyne, is a software application that allows researchers to write simple scripts to display raw topological data in full 3D inside the CAVE, then navigate to any point inside the data set using motion-tracked glasses and a gamepad. With it, users can also view multiple related data sets, create selections and slices of data, and navigate customized menus. Data can be displayed in a variety of ways, such as a color-coded representation of a topology, an animated path of an object through space, or a set of gradient vectors that indicate directional data. vGeo is also capable of streaming data from external models in real time.
With the vGeo package, researchers can write simple scripts to display raw topological data in full 3D inside the CAVE, then navigate to any point inside the data set using the motion-tracked glasses and gamepad. Users can also view multiple related data sets, create selections and slices of data, and navigate customized menus. Data can be displayed in a variety of ways, such as an animated path of an object through space, a color-coded representation of a topology, or a set of gradient vectors that indicate directional data.
vGeo-stormWorld is a specific vGeo script, used to visualize aspects of a particular “Perfect Storm” that took place in 1991. Real data about this storm was collected by Argonne National Laboratory. Floating above a section of Earth affected by this storm, users can observe hurricane wind patterns, humidity, and the path of a ship eventually swallowed by the storm.
This script provides a demonstration of how the CAVE can visualize and process data collected for a significant real-world application, showcasing the CAVE’s capability for enhancing data-intensive research.
Google Earth

The CAVE in tandem with Google Earth clearly demonstrates immersion in familiar real-world environments. Reporters who have taken part in Google Earth demonstrations have compared themselves to both Spider-Man and Superman, heroes known for their high vantage points above terrain. The application has also been described as strikingly close to the immersive Holodeck of Star Trek fame. As a popular, free download, the Google Earth application is itself familiar to many demonstration participants. It is often the first demonstration presented by the CAVE team because of its focus on visuals and familiarity. Participants can immerse themselves in any city, landmark, or point of interest on planet Earth and view surrounding topography, terrain, satellite imagery, and, in many cases, buildings. This data is indirectly provided by a variety of sources and synthesized by the Google Earth application. Users can navigate through the scene with full six degrees of freedom.
Trimble Sketchup
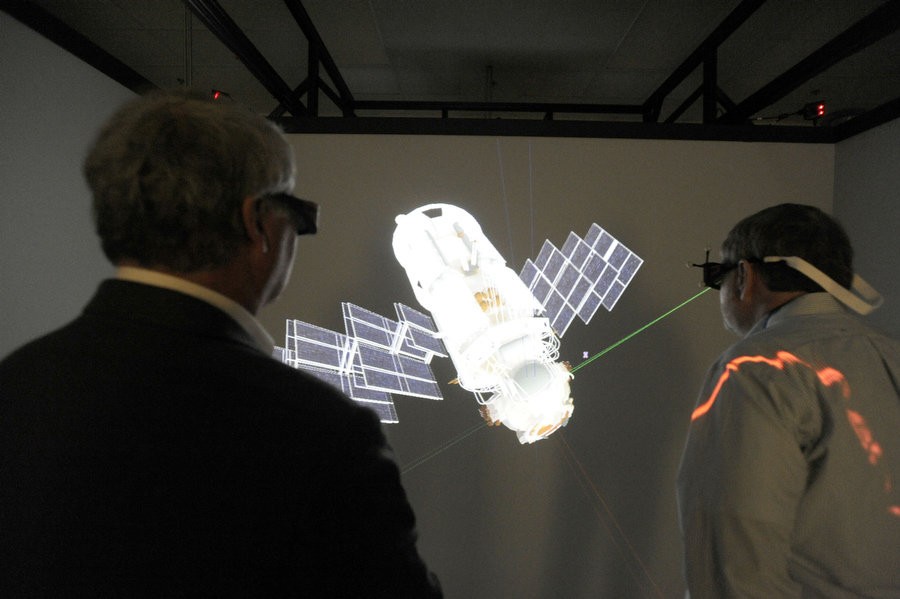
Trimble Sketchup is centered on showcasing CAD designs, providing a direct relationship to the problems faced by engineers, though the team has also found other applications for the software.
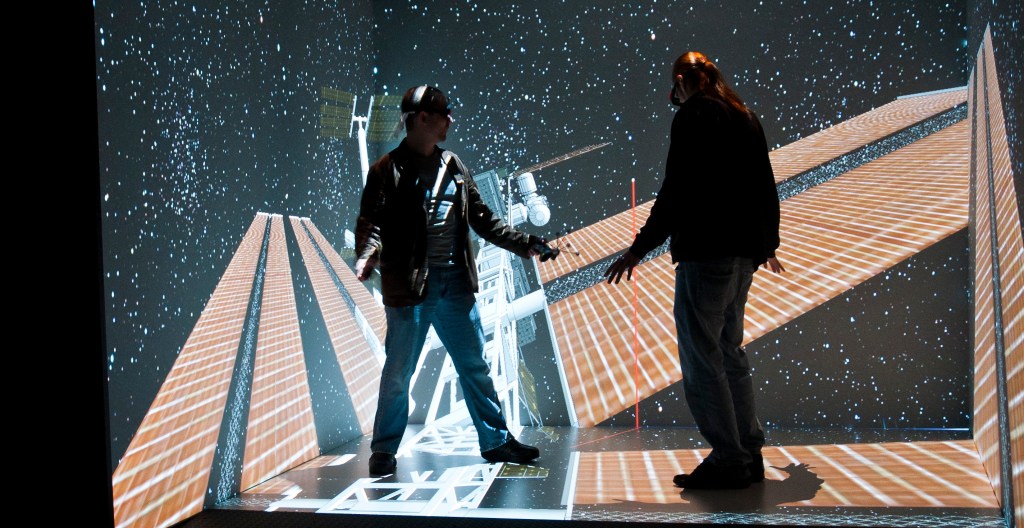
The team has selected several pre-made models most appropriate for demonstrating the capabilities of the CAVE to a variety of audiences. Operators can load these models through a few simple mouse clicks. For outreach, marketing, and demonstration, the most widely-used models include the inside of a Seattle apartment, several components of the ISS, a full view of the ISS itself, and the inside of a vet hospital’s architectural design.
Conduit
Mechdyne’s Conduit program essentially intercepts 3D graphics software calls from other programs and displays the content of those programs in full 3D inside the CAVE. It works with a variety of software, including raw OpenGL-based demos.
Virtual environments supplementing human analysts
Owing to my studies in HFE, visualization, and cognition, I was especially interested in potential human factors-related considerations to do with the CAVE. Research using the CAVE requires more than knowledge of computer programming. There’s a whole psychological aspect that needs to be considered when conducting experiments and writing research plans.

But the CAVE also has applications beyond 3D virtual environments that mimic notional or geospecific scenes. The advantage of a system such as the CAVE for virtual environments and training are readily apparent — it provides an immersive experience. It turns out that the human brain can work with a 3D space in other ways as well.
One other useful but underutilized application is its ability to allow researchers to “navigate through” data. In terms of data analytics, the CAVE can be compared to a chart or graph with several additional dimensions. Just as with a graph, it is populated by some data set of interest and visualized for easier consumption by human analysts or stakeholders. In the CAVE, the environment is animated, data layers can be toggled or emphasized, and zooming and panning can give context to individual pieces of data.
In this way, the CAVE works as an analysis tool that supplements human beings. Patterns and insights may emerge as a function of human cognition and intuition rather than through processing by machines. In essence, the CAVE is a tool that can be used to augment human analysts.
Media features
- UAHuntsville, 2012 UAHuntsville Annual Report. Accessible at https://issuu.com/uahuntsville/docs/uah_annual_report_2012.
- “Alumni Lunch & Learn: UAH CAVE Demonstration with Gregory Reed.” The University of Alabama in Huntsville. N.p., 15 Apr. 2013.
- Steele, James. “Welcome to UAH’s CAVE.” The University of Alabama in Huntsville. N.p., 22 Jan. 2013.
- Roop, Lee. “3-D cave lets University of Alabama in Huntsville students ‘see’ all sides of data.” AL.com. N.p., 07 Jan. 2013.
- Demonstration and Interview, Huntsville Times, November 26, 2012.
- Demonstration and Interview, Huntsville Times, November 7, 2012.