Wherein an interdisciplinary team of university researchers developed a novel statistical approach and dashboard software package for hospitals to survey their units
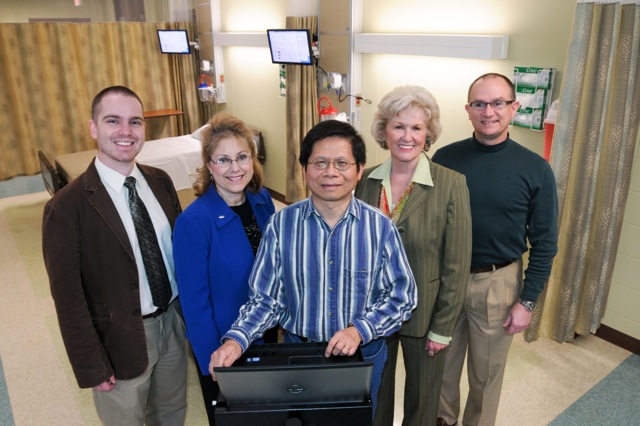
InnovaInsight, also known as the Charger Nursing Dashboard, was one of my major undertakings as a researcher and one particularly interesting highlight in my career so far. This decision analysis software package was the culmination of the efforts in a highly interdisciplinary collaboration among five of us at the University of Alabama in Huntsville.
It also led to a provisionary patent of some of its underlying methods and the founding of a startup company, Decision Innovations.
I was the Dashboard’s software developer, primary designer of its user interface, and the architect of the data flow and databases underneath it. The software was implemented in Java for portability, and the data was populated, synthesized, and retrieved using a combination of C++, XML, and SQL. Each hospital had its unique data structure and tool set, and so some software modules needed to be catered to each individually.
Background and motivation
In 2008, faculty in the College of Nursing conducted a pilot study with the Catholic Health Initiatives (CHI) hospital system to explore the relationship between nursing care and patient outcomes. They saw the need for an integrated, data-driven picture.
Having acquired a large amount of empirical data from CHI hospitals represented across the United States, they started collaboration with faculty in the College of Business to work on approaches to find specific mathematical relationships among variables within the data.
Nurse managers and executive leadership within hospitals were typically forced to rely upon several independent software tools that each presents them with certain pieces of information, such as patient mortality, staff turnover, and patient length of stay, among many others. These tools rarely worked with one another. And due to the independent and “stovepiped” nature of these tools, leadership did not have access to information on the correlations among these factors.
If managers were to have access to a synthesized picture, they could possibly optimize several different and disparate outcomes, such as patient satisfaction and financial status, at the same time.
They realized that a decision support tool to provide nurse managers with a survey of the overall status of their hospital units which would allow managers to make more informed and optimal decisions on nurse staffing.
My colleague — also my advisor and mentor — and I joined in the collaboration to develop the software that would ultimately synthesize data, use the statistics and mathematics found in the group’s previous research, and display and allow for exploration of the interrelationships and unit status in an intuitive and uncomplicated way.
We were provided with several more large datasets from many different types of hospital units that dealt with many different aspects of a hospital unit’s operation.
Relationships among data were valuable — but at the same time, also hidden from the stakeholders, complicated by unforeseen correlations, and completely unavailable with the current software infrastructure at most hospitals. Throughout our initial research, we found correlations in the data that we did not expect to find. For example, a regression equation for calculating mortality may end up being based on several disparate input parameters, such as the number of registered nurses on staff, the number of hospital beds available, the number of patients per registered nurse, and the average mortality index.
This further motivated development of the dashboard — since we knew that stakeholders in hospitals did not know of these correlations, either.
Having had some “practice” in, we approached the development of InnovaInsight with the information we had gathered and additional research we had undertaken.
The most daunting part of the task was the notion that decisions made in hospital units are often literally life-and-death, and, further, that they often need to be made with very little time for contemplation. Not only was it important to extract and integrate data reliably, but it was also absolutely critical to have a frontend and user interface that could present that information in a way that would aid such high-stakes decisions.
From concept to interface
From the outset, our team of five had a robust general vision for InnovaInsight. We knew that, at minimum, we needed to support decisions to be made in the moment, on-the-fly, in potentially hectic settings and with ever-changing states of the hospital units. This would require a large, robust, and representative dataset to feed variables for regression equations to allow for synthesis and predictions. Facilitating positive outcomes was key.
Because of the unique “in-the-moment,” critical, real-time nature of nurse managers’ decisions, we needed to ensure that the UI presented information in a manner that required as little cognitive processing as possible to allow for quick decisions and, further, that the data for some given hospital unit could be synthesized on-demand and in real time to drive the information displayed.
The nursing faculty members on our team were very well-versed in the users’ language, so to speak; but we still needed to solicit outside feedback as we iterated on the feature set, design, user interface, and overall feel of the software. Nurse managers would be the primary users of the software, but the interface needed to be intuitive and useful for the unit as a whole. Nursing is highly collaborative, and it is critical for all nurses working together to have a common picture. Thus, we needed to design with some variety of personas and uses in mind. Managers and technicians alike needed to be able to understand how to use the software, albeit to different degrees and in different ways.
We consolidated down to what were essentially two use cases: “reading” and “writing. Technicians, floor nurses, and nurse managers would be interested in at least “reading” the state of their unit: being shown raw data such as patient diagnoses, comorbidities, and available staffing; as well as aggregated information feeding outcomes. These were intended to help drive in-the-moment decisions.
Nurse managers, however, would additionally be interested in prediction — in how they could potentially change the state of their unit; in how they could “write” it. They may ask questions such as, “How would adding more staff affect the expected number of patient falls?” To answer “what-if” questions like these, we needed to allow users to override data presented to them — such as increasing the number of nurses on staff from the current value — also in an intuitive way. While we could expect for these “what-if” questions to be answered with less real-time pressure, we also needed to make sure we clearly delineated reality from any “what-ifs” being analyzed.

We iterated through many sketches and continually tweaked a wireframe design. After we settled on a sketch that we believed would give a start on allowing for intuitive “reading” and “writing,” I implemented a prototype of the software. Although the prototype did not incorporate data in real time, it did represent the look-and-feel of the software — and it did provide feedback to user input through changing values and updating charts. It was designed in such a way that the basic components could be easily modified, rearranged, and added and removed. This would allow us to quickly incorporate user feedback.
User feedback was critical in the design process, driving both the interface and the features of the software. To collect initial user feedback, we developed the Dashboard Assessment Survey. It was fairly typical for surveys of its kind, with Likert scale responses on assessments of satisfaction on different aspects of the interface. A semantic differential scale also helped pinpoint the users’ reception to the “feel” portion of the interface’s “look-and-feel.” Through feedback, we were also inspired clustered information in a particular way: separating it into patient outcomes, hospital-acquired conditions, patient satisfaction, and organizational outcomes.
We started with our existing connections to managers and nurses and then solicited outside feedback.


User feedback led us to place heavy focus on the “what-if” analysis portion of the software, the predictive component that would allow nurse managers to investigate the impact of changes on outcomes. This “what-if” mode of operation became the software’s primary advantage, one missing from virtually all other products of its kind as used in a hospital setting.
Experimentation and exploration are major advantages of modeling and simulation in general — the ability to “play with” the real world without “breaking” it — and so this mindset was a natural fit for me as a simulationist.
Potential use cases for this “what-if” analysis include readily making staffing decisions that can drive outcomes toward more acceptable levels, determining whether the addition of more hospital beds will be financially advantageous, or preparing for an influx of patients during an emergency. When the user enters Scenario mode, the current status of the unit is loaded as the default scenario. This allows the user to start making potential adjustments starting with the reality of the unit’s current situation. Custom scenarios can also be saved to a file and loaded later for future analysis and review.
Owing to this focus brought about through user feedback, we deemphasized — but did not (and absolutely could not) outright ignore — the real-time nature of the software data collection. We could also keep the interface minimal and functional. (The final product, at least before Decision Innovations as a corporation existed, actually resembles the prototype.)
We also needed to make sure we clearly differentiated between real data and “what-if” data, so that decisions that were intended to be on-the-fly were not using fabricated data. We delineated into two distinct modes: “Status mode” and “Scenario mode,” the former focused on relaying the current status of the unit and the latter on exploring changes. This also led to the development of several features related to the Scenario mode. One was the ability to save and load scenarios, sets of changes and overrides that represented nurse managers’ experiments.
Data is populated in real time, with the option to manually override data; and four sets of outcomes (Patient Outcomes, Hospital-Acquired Conditions, Patient Satisfaction, and Organizational Outcomes) are calculated based upon this data. The Patient Information tab additionally displays real-time information about patients in the unit, which is useful in and of itself and also serves as input into the software’s equations.
The underlying infrastructure
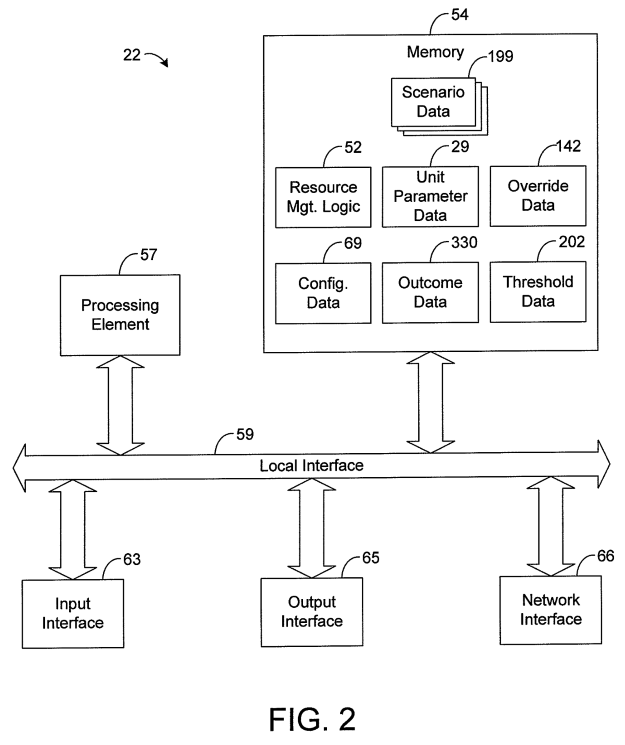
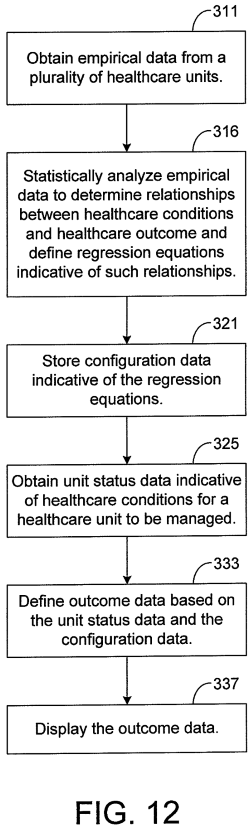
True to form following function, the backend needed to be well-planned and robust as well. Although the implementation was complicated, the flow of data itself is not too difficult to understand. The software synthesizes the data collected from tools within a hospital system, filling in gaps with previously-defined empirical data where real-time data is not available (which is often the case in smaller hospitals that do not have robust data collection mechanisms).
In this synthesis also are any manual overrides made by a user in the creation of a scenario in Scenario Mode. Data is transmitted across the network to local workstations where the software is installed. These variables are fed into regression equations and are processed by the software to display outcome informatio associated with all of the synthesized data.
Commercialization and incorporation
After we had matured the product, we worked with the UAH Office of Technology Commercialization to pursue a commercialization effort. We submitted an entry 2011 Alabama Launchpad business plan competition, hosted by the Economic Development Partnership of Alabama. The competition was partitioned into phases, collectively requiring an “elevator pitch,” business plan, and final presentation. In a competition of 44 entries, ours was awarded the grand prize, which provided us with additional exposure and $100,000 in seed money to incorporate Decision Innovations. Our success was largely a function of a provisional patent on our methodologies, the fact that we had a working prototype with real user feedback, and the rigorous testing of the backend that we had performed to make sure the product worked as expected.

Owing to my additional responsibilities as CTO, we passed software implementation responsibilities on to an independent contractor once we incorporated. The final design was based upon my initial prototype and additional mockups, and that final implementation included an even clearer depiction of predicted variable states present in some of the wireframe designs but absent from the prototype.
We presented to many interested parties, most local to north Alabama. However, even with the provisionary patent filed, there were mounting legal costs associated with prosecuting it fully. Without the patent completely in hand, it was risky for us to formally sell the product. The patent, one of the keys to our success in the Alabama Launchpad competition, became an insurmountable obstacle to the company’s existence.
Ultimately, the company was unable to generate enough capital to offset legal costs. In August 2015, we decided to dissolve Decision Innovations. The product, the competition, and the shared experience, however, were major successes for our highly interdisciplinary collaboration.
Related media
- UAHuntsville Alumni Association, “Nursing Dashboard: UAHuntsville software can improve health care quality, timeliness,” UAHuntsville Alumni Update, October 2011.
- Kelley, M., “UAH professors win major business competition in launching Decision Innovations,” al.com, September 30, 2011.
